We got a picture were someone throws a basketball. The task was about to find out if the ball is going to land in the basket or not.
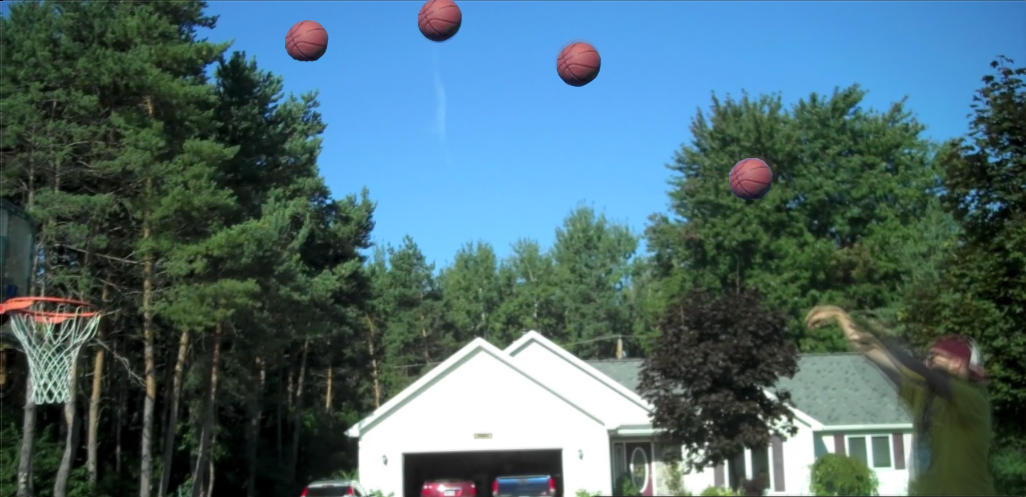
To find that out i used Desmos. It took a long time to put all the points on the basketballs.
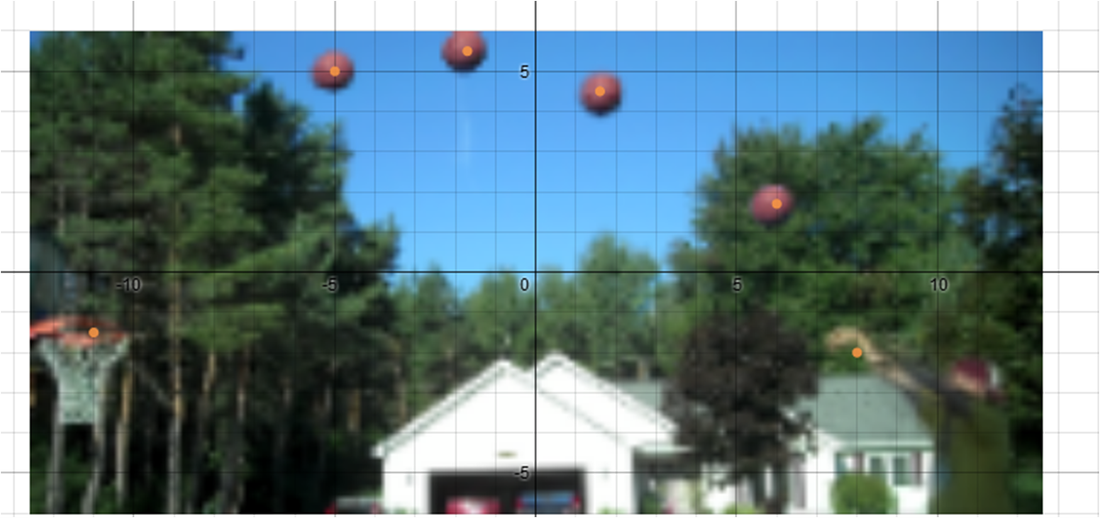
But after i was done doing that i realized that i didn't really needed them because there i no tool to connect them to a graph.
But after i was done doing that i realized that i didn't really needed them because there i no tool to connect them to a graph.
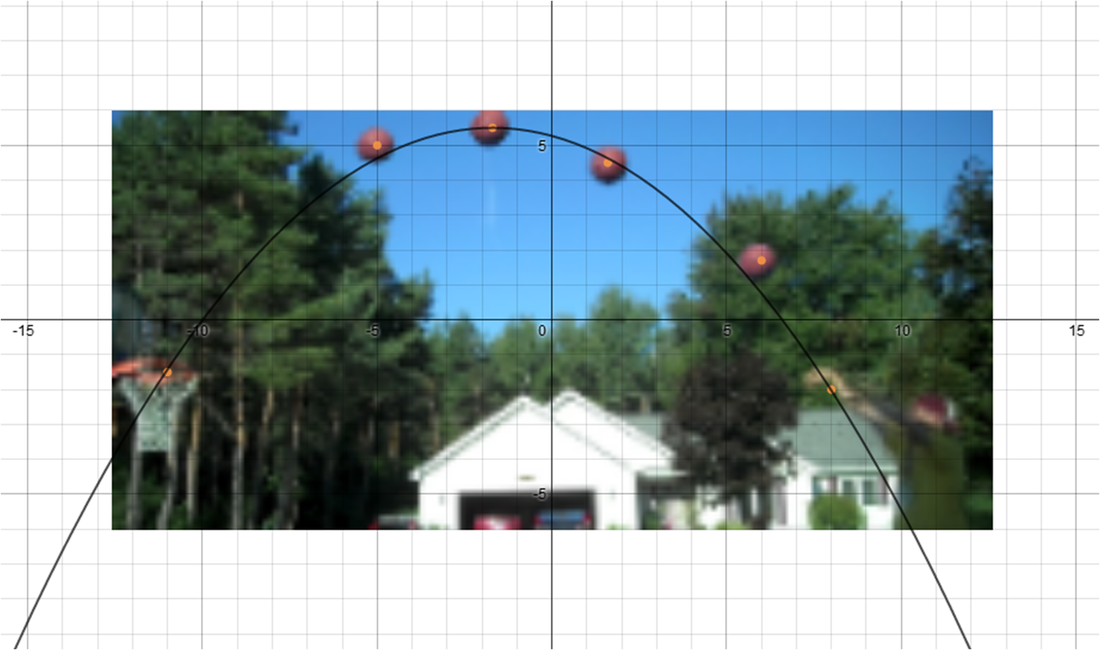
So I created a graph. The graph has 3 variables : a,h and k.
By changing those i adjusted the graph until it fits over the basketballs.
Here you can see the final state.
By changing those i adjusted the graph until it fits over the basketballs.
Here you can see the final state.
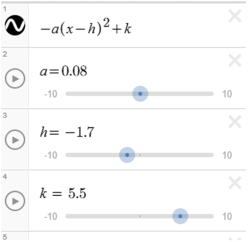
To the left you can see the adjusted variables.
The function is -a(x-h)^2+k .
The function is -a(x-h)^2+k .
 RSS Feed