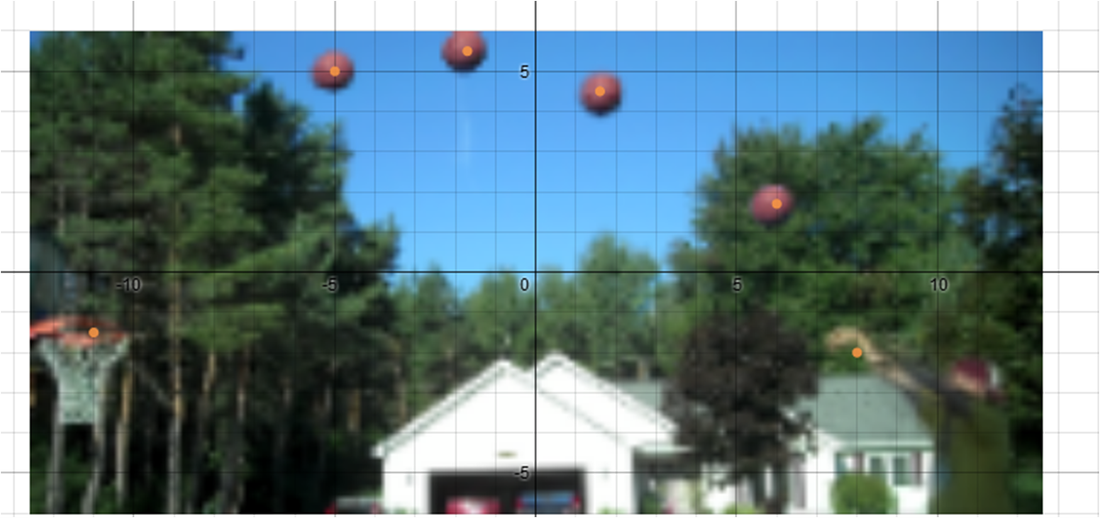
We had to analyse the data of an given graph ( as seen below) and determine what kind of function it is.
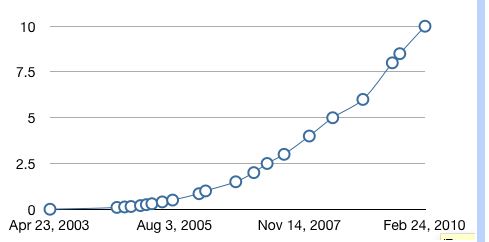
I think that is an exponential groth, because you can see that its not proporional.
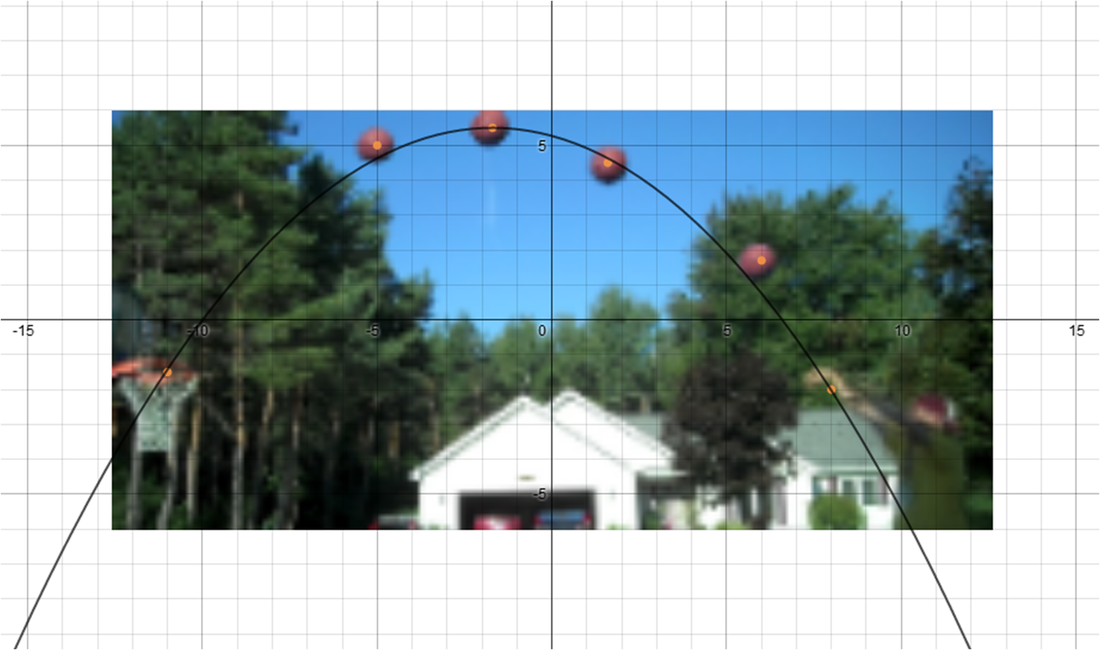
After that i had to find aout the mathematical model of the graph.
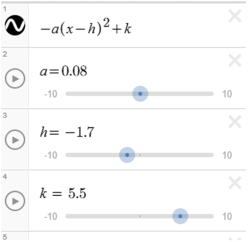
To do this i used Desmos.com.
After that i had to find aout the mathematical model of the graph.
To do this i used Desmos.com.
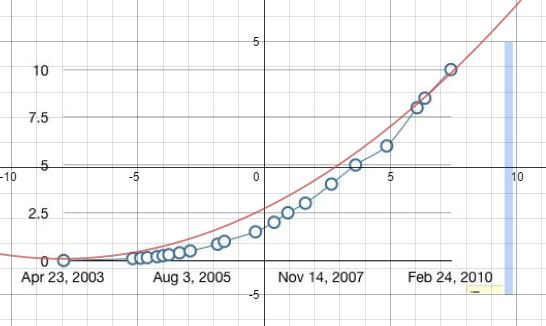
After a few minuits i had a graph that matchd more or less with the one from the Picture.
| After that we had to find out the domain and the range of the function. The domain of the function is : -> all real numbers [-∞,∞] Range: f > -3.6 I am not sure about this above. | 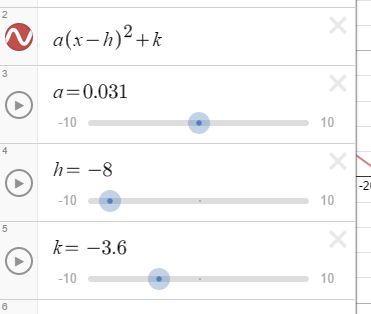 |
Then we had to read an artical about the sells of the Itunes market.
Including the numbers from this Text i think that the graph will from 2013 on negative proportional.
That means that the Range will be smaller.
Including the numbers from this Text i think that the graph will from 2013 on negative proportional.
That means that the Range will be smaller.
 RSS Feed