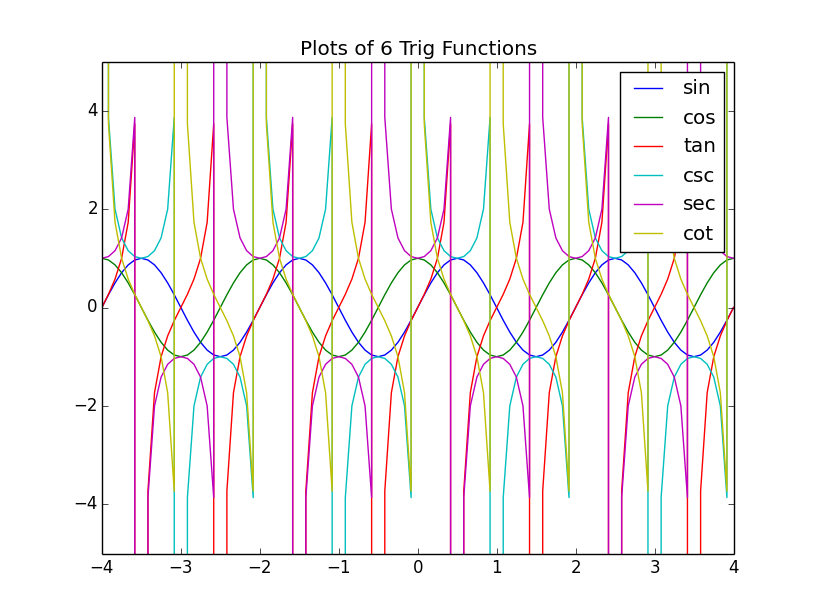
Instead of making all those 49*6 Calculations i wrote a Python Program.
I used a Libary called "matplotlib" wich would makes it easy to create scientific Figures.
You can see all the steps i went through in my "Option A- Trying stuff out" Blog post.
There is a functional version of this, that uses Turtle and runs in the Web (trinket link ) but i like the matplotlib version (as seen below) better even though it only runs offline. (code)
The Table of Values is also created by my Python Script.
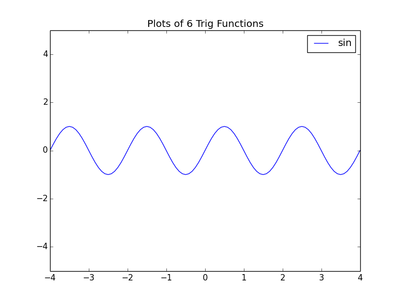
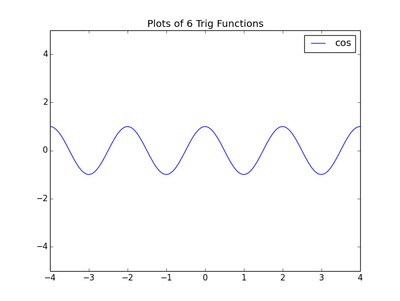
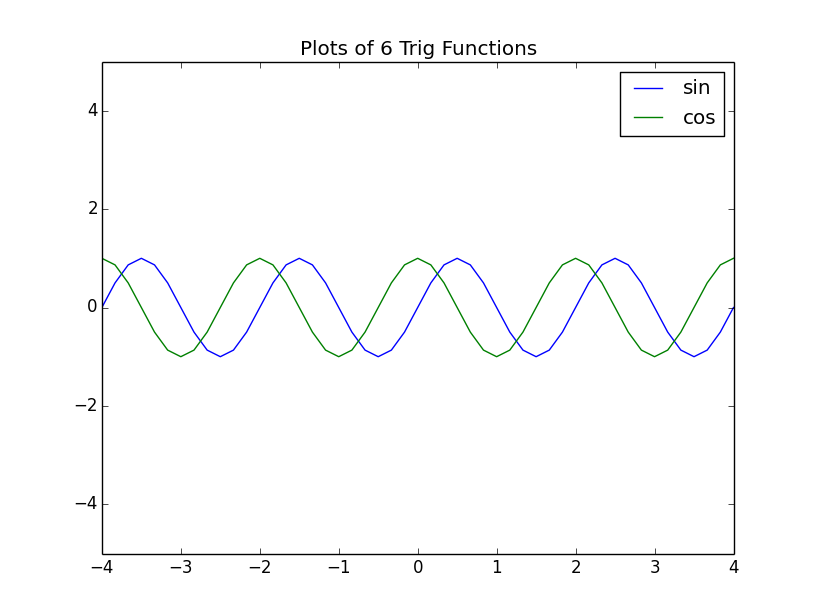
Compare Sin and Cos:
As you can see below , the cos is shifted by 1/4 of the Period. This results in the Sin Wave "starting" at 0 and the Cos "starting" at 0+amplitude.
As you can see below , the cos is shifted by 1/4 of the Period. This results in the Sin Wave "starting" at 0 and the Cos "starting" at 0+amplitude.
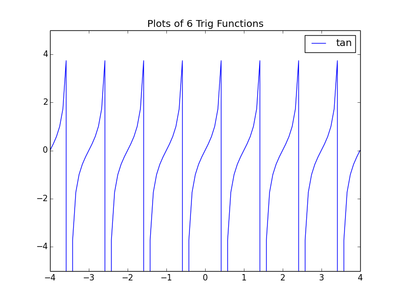
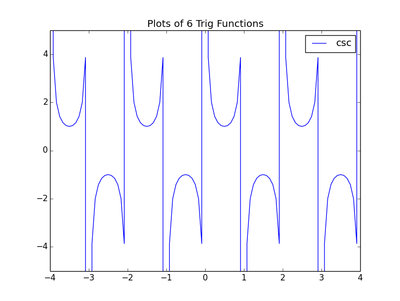
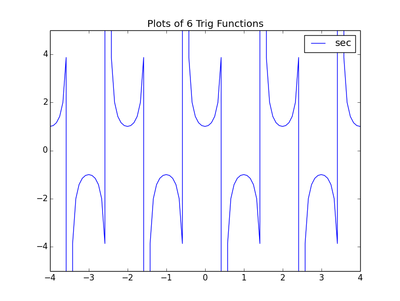
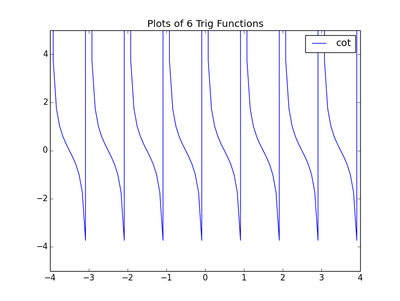
The vertical asymptotes : If you run the turtle Version the asymptotes do not get plotted.
That way you can see fairly easy wich lines are actually asymtotes.
That way you can see fairly easy wich lines are actually asymtotes.
 RSS Feed